As I have pointed out before, the "average" Numerai forecasting model seems to go through periods of good and bad performance -- a sort of performance cycle. If you believe this, then you might be concerned with where we are in the cycle if you want to increase your stake. All the more so recently with reputation -- one of the performance measures -- climbing to above 0.07 for the top 20 forecasters. And I think with the recent positive performance and therefore payout, the stake size in the tournament now stands at 50121NMR or $330,297 (NMR=$6.59).
The current staking mechanism has compounding built into it -- any gains incur each week are added to the stake for the future -- you ideally would not want to add a sizable stake and then immediately get hit with a down cycle. This would be akin to putting a sizable stake in the stock market in June 2008 before the market crash versus waiting a year and stake in June 2009.
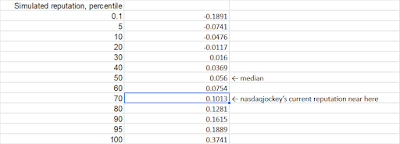
So where are we in the cycle? I estimated a reputation curve via Monte Carlo simulation and a top reputation now at 0.1018 would be at the 70 percentile of that curve. I.e., we are getting near the top. You can find details on the definitions of the performance measures like avg correlation/reputation and how they relate to payout/bonus in the Numerai documentation.
You can find my work in a google spreadsheet here (link). Below I outline my method and findings.
Method
I pulled the data on Dec 30, 2019 from the Numerai website. Going for simple, I pull the daily forecast performance data (avg correlation) of the top forecaster, Nasdaqjockey. Recall the sum if the last 100 day's avg correlation is reputation. I focus on building a reputation curve because a high reputation means a string of recent good performance and suggests bad performance soon is increasingly likely.
The data goes back to Jul 18, 2019, and for the simulation I draw with replacement from this and calculate 1000 instances of reputation.
Findings
From now to Jul 18, 2019, the max value for avg correlation is 0.0285 and the min value is -0.0206. In the 1000 simulations, the max reputation value is 0.3558 and the min is 0.02546. The average is 0.0638. Since Nasdaqjockey has been near the top consistently, I would guess the steady state value for a very good model would be in the 0.06 range.
The following table shows the values at the percentiles.
I think the higher the reputation value goes, the more likely a bad cycle will be coming. While it seems like there's still room to climb, I would urge caution. Note also the above curve is based on Nasdaqjockey's model performance. You can do the above for your own model, referencing the formulas in the linked spreadsheet as needed, and try to gauge where your model is relative to its reputation curve.
