Numerai dashboarding and accessing daily performance data, Part 3 (February 5, 2020)
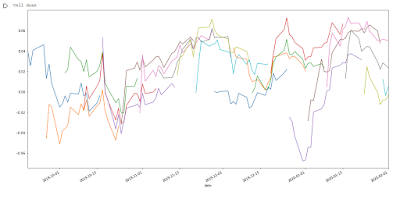
Part 3 (and the last part) is a Colab notebook (link) showing how to access the daily performance data so you can figure out how you are doing in metrics like "Average Correlation|Deltas", "Reputation", or "Rank". An example of a graph the Colab notebook generated is here:
The second set of code gets and plots the "Average Correlation" for the submissions over the 4 week periods. It looks something like this:
The first graph admittedly isn't all that useful. For me, it's just a way to take a quick look without having to go to the website. I would be more useful to plot stakers that you are interested in as a benchmark against yourself. If that's something you are interested in, look at the code in Part 2 (here) and apply it to the data here.
The second graph in some situations can give you a better feel for possible trends going forward. Recall Avg Correlation|Deltas is the difference of the daily sum vertically. And reputation is the sum of the Avg Correlations|Deltas over the past 100 days. Just a quick glance at the data, as was with the old iteration of the contest, there are some rather strong correlations over time. And using that can give you an educated guess of how the deltas might change over the next week or so.
Part 1 dashboarding the leaderboard data
Part 2 verifying Numerai submission

